
How We Debugged And Fixed 'EMFILE: too many files open' On AWS Lambda NodeJS
03 Jun 2021tl;dr: Move initialization logic outside of request handlers.
My team is building a new application, and I used CloudWatch alarms to understand what latency promises we could make without triggering the alarms too often. I set these alarms to fire when 3/3 datapoints breach the alarm’s threshold, and noticed an interesting pattern from multiple triggered alarms: A sharp increase in latency (hundreds of ms to multiple seconds), followed by a function timeout (30 seconds), again followed by a cold start.
Our application consists of a couple AWS Lambda functions and other serverless infrastructure, with a NodeJS 12 environment. One monolithic function backs an API Gateway endpoint. The Lambda function uses aws-serverless-koa for routing requests to the right handler, and the AWS SDK for JavaScript to call other AWS services like DynamoDB.
Prerequisites
This article assumes that you’ve already built a NodeJS application on AWS Lambda, and have some experience with the AWS CloudWatch service.
How To Analyse The Logs
As the latency spike and timeouts happened somewhat regularly, I checked the logs of the function in question. With CloudWatch Logs Insights we can pick a timeframe, a function’s log group, and a query that we modify as we narrow down to the problem.
I used the query below to find the latest 50 errors that caused the Lambda function to fail.
fields @timestamp, @message
| filter @message like /ERROR/
| sort by @timestamp desc
| limit 50
In the resulting logs I saw an error with the message EMFILE: too many files open. To understand what happened leading up to this error, I filtered for
the @requestId to let CloudWatch show me all logs for that particular request. You can find the value field in the @message field from the previous query.
fields @timestamp, @message
| filter @requestId == "my-request-id"
| sort by @timestamp desc
Unfortunately this didn’t yield any new insights, so I defaulted to googling around a bit. I stumbled upon a few articles that explain how one can show the open file descriptors on a unix server. With Lambda that’s not possible though, as you can’t SSH into your Lambda instance. However one of the articles mentioned in its footnotes that Lambda Insights supported file descriptor metrics since late 2020.
I also saw mentions of the environment variable AWS_NODEJS_CONNECTION_REUSE_ENABLED, but I didn’t feel like I had enough data to support this change apart from “let’s see if it works or breaks”.
How To Get Lambda System Metrics
Lambda Insights uses Lambda Extensions to gather system metrics such as CPU and RAM usage from our Lambda functions. If you want to try out Lambda Insights yourself, go checkout this section in the AWS Observability Workshop.
Lambda Insights collects a bunch of metrics and one of them is the file descriptor usage fd_use.
These metrics are not automatically collected. Instead, you have to navigate to your Lambda function’s configuration, enable Enhanced Monitoring, and wait until some data has been gathered.
To enable Enhanced Monitoring go to your Lambda function’s configuration, then to Monitoring and Tools, click on Edit, and toggle the switch for CloudWatch Lambda Insights. This will add a layer to your Lambda function, through which CloudWatch gathers system metrics by using the CloudWatch EMF logging format.
Some metrics are directly visualized in the Lambda Insights section, but not the file descriptor usage. Through EMF it’s however available in the CloudWatch metrics, from which we can create graphs ourselves.
Lambda Insights uses the metrics namespace /aws/lambda-insights.
To visualize the file descriptor usage, navigate to CloudWatch Metrics, pick the namespace /aws/lambda-insights and select the metricfd_use. When you select Maximum for statistics, and an aggregation
range of 1 minute, you should see a graph like below (if you use up file descriptors without releasing them).
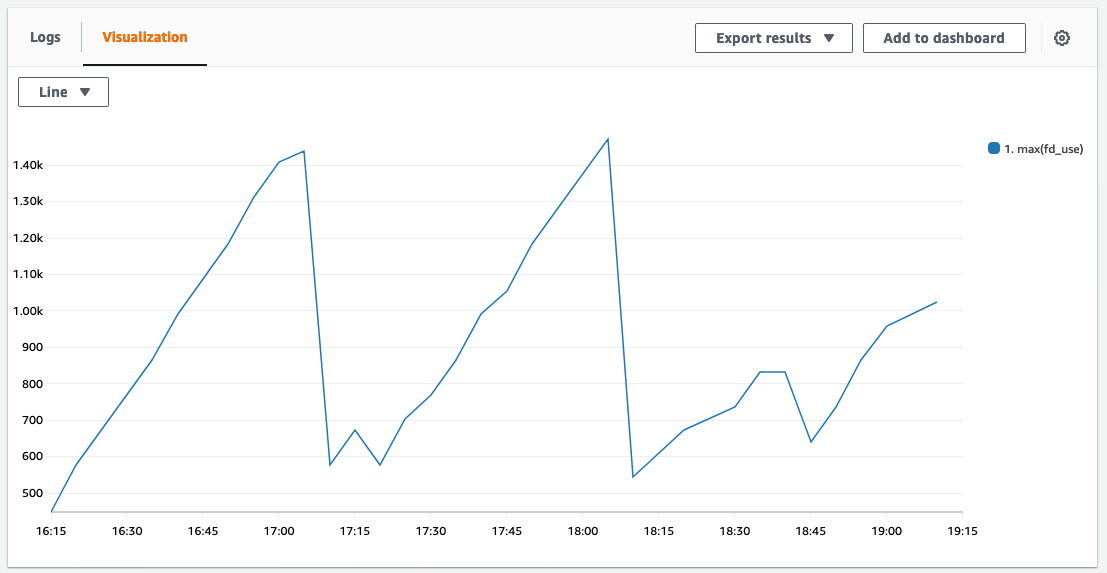
Notice the drops? They happen at exactly the same moment when the function times out and the EMFILE errors appear. Looks like we have a match! Let’s have a look into the details of the file descriptor
usage with the NPM package wtfnode.
How To Get More Details About File Descriptor Usage
My teammate Pieter found an NPM package called wtfnode which helps us better understand what’s going on in Node’s active handles.
Here’s an example of how the result of using wtfnode looks like:
[i] app/24191 on devbox: Server listening on 0.0.0.0:9001 in development mode
^C[WTF Node?] open handles:
- Sockets:
  - 10.21.1.16:37696 -> 10.21.2.213:5432
    - Listeners:
      - connect: anonymous @ /home/me/app/node_modules/pg/lib/connection.js:49
With the information from wtfnode were able to pinpoint which piece of our code created the most sockets: Our code created a new app with custom routing logic on each request, which led to unclosed file handles.
Fix 1: Move Initialization Logic Out Of The Request Handlers
Below you can see the code, where we created a new server on each request. With this approach we create a new file handle, and eventually run out of available handles.
import { createServer, proxy } from "aws-serverless-express";

const app = initApp(); // some custom logic

export const handler = async (event, context) => {
    // this was causing the file descriptor usage to go up
    return proxy(
        createServer(app.callback(), event, context, "PROMISE")
    ).promise;
}
By refactoring our code to call createServer() outside of the request handler, the method will only be called when AWS Lambda initializes our function.
import { createServer, proxy } from "aws-serverless-express";

const app = initApp(); // some custom logic
const server = createServer(app.callback()); // this is now only called during lambda initialization

export const handler = async (event, context) => {
    return proxy(server, event, context, "PROMISE").promise;
}
Fix 2: Enable SDK Connection Reuse
While not required for fixing the EMFILE error, we also enabled connection reuse for the AWS SDK in NodeJS runtimes. To enable this set the
environment variable AWS_NODEJS_CONNECTION_REUSE_ENABLED to 1. This should improve execution times a bit, as our Lambda function doesn’t need to open a new connection for each request.
You can change environment variables through the console, but to keep your changes over multiple deployments, you should use infrastructure as code.
My team uses the CDK. With the CDK you can use the environment field to
set environment variables for Lambda functions.
Verifying The Fix
To verify if the change worked, we compared the metrics from before and after. We also checked the logs if EMFILE errors still appear.
Below you can see a graph that visualizes the file descriptor usage. It’s now constantly below 500, which is a good sign. The graph looks a bit bumpy because it doesn’t start at 0.
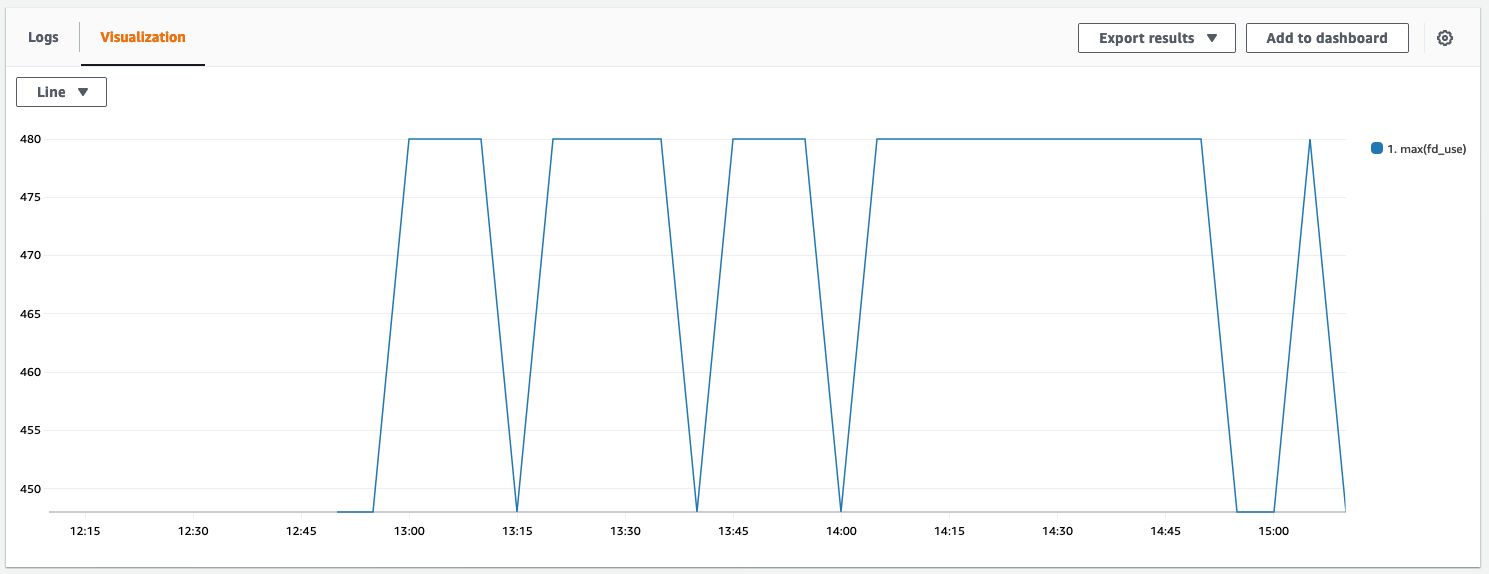
In the logs we didn’t find EMFILE errors anymore. Problem solved \o/
Conclusion
Initialize as much as possible outside of request handlers. Try not to do custom routing with servers created in Lambda, but let API Gateway do the job for you.
Lambda Insights and wtfnode are good tools to debug errors that are closer to the runtime/system than normal application level error messages.
It would be nice if AWS would enable Lambda Insights and connection reuse by default. We haven’t seen any downsides to using them.
Enjoyed this article? I publish a new article every month. Connect with me on Twitter and sign up for new articles to your inbox!