

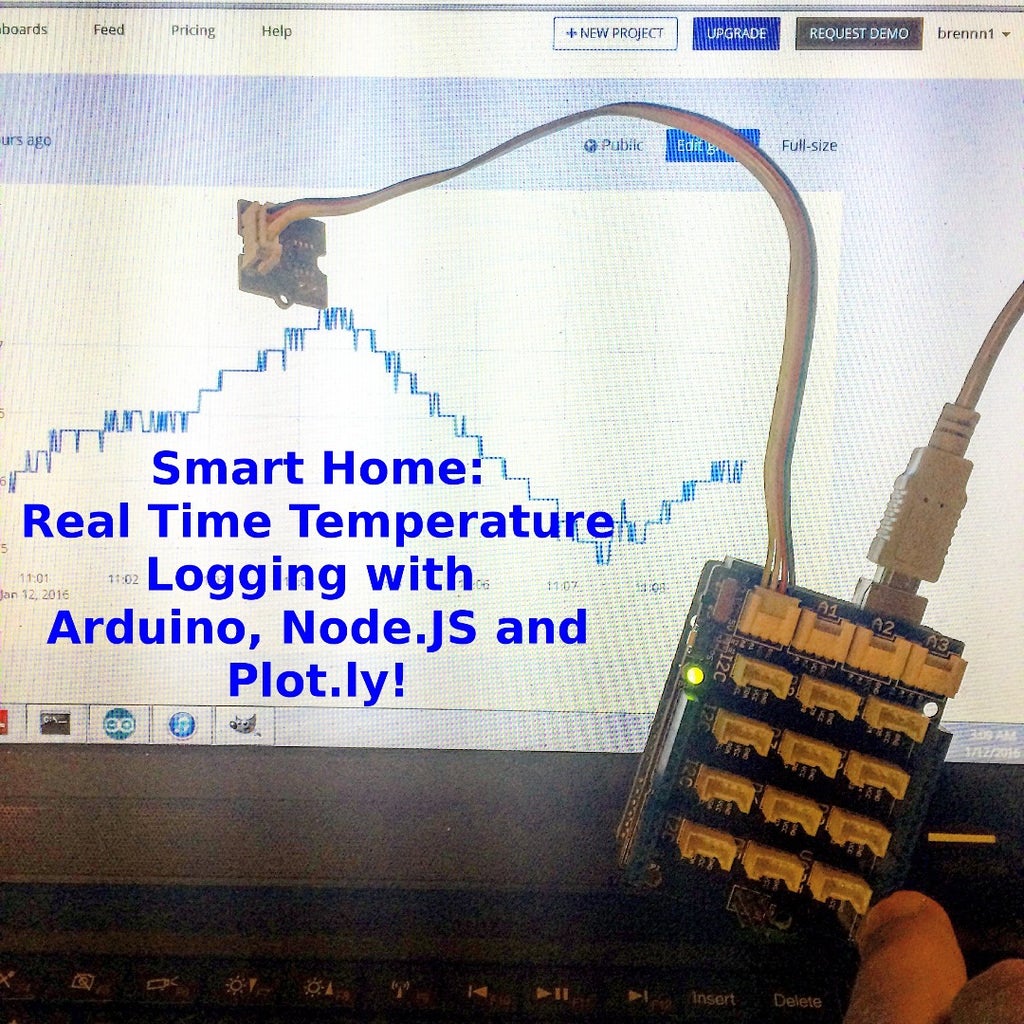
Introduction: Real Time Temperature Logging With Arduino, NodeJS and Plotly!


![[Collegiate Exercise] Dorm Room Fitness](https://content.instructables.com/FPR/85RY/GPBDG81Y/FPR85RYGPBDG81Y.jpg?auto=webp&crop=1%3A1&frame=1&width=130)

The motivation for this project sprouted after reading about Mark Zuckerberg's desire to create a Smart home for one of his 2016 projects. Being intrigued myself, I wanted to try to implement a very basic temperature logging application that could send the data to the web. For me, I was interested in seeing how quickly the temperature dropped to the temperature that I set my thermostat to when I leave my home for the day.
Naturally, there are many ways to do this, but I wanted to implement something that wasn't too involved. I also wanted to document my work in a way that allows hobbyists in a similar situation as me to try this at home too! I hope that these instructions are easy to follow, so please let me know if you have any questions!
I think this project is great because it employs elements of electronic circuits, JavaScript (Nodejs), and the application layer where we can visualize the data with Plotly!
Please note, I am using the Grove Shield and a Grove Temperature Sensor for this project. But don't be worried! The process is still the same, regardless of the sensor data or circuit that you are using to generate an analog signal for your Arduino! I will go into this later in this Instructable, for alternatives to the Grove Shield and Grove Sensor!
Let's get started!
Step 1: Hardware Needed


Hardare Needed:
If using the Grove Shield and Grove Temperature Sensor:
1x Arduino Uno Microcontroller
1x USB-Serial Cable for Arduino
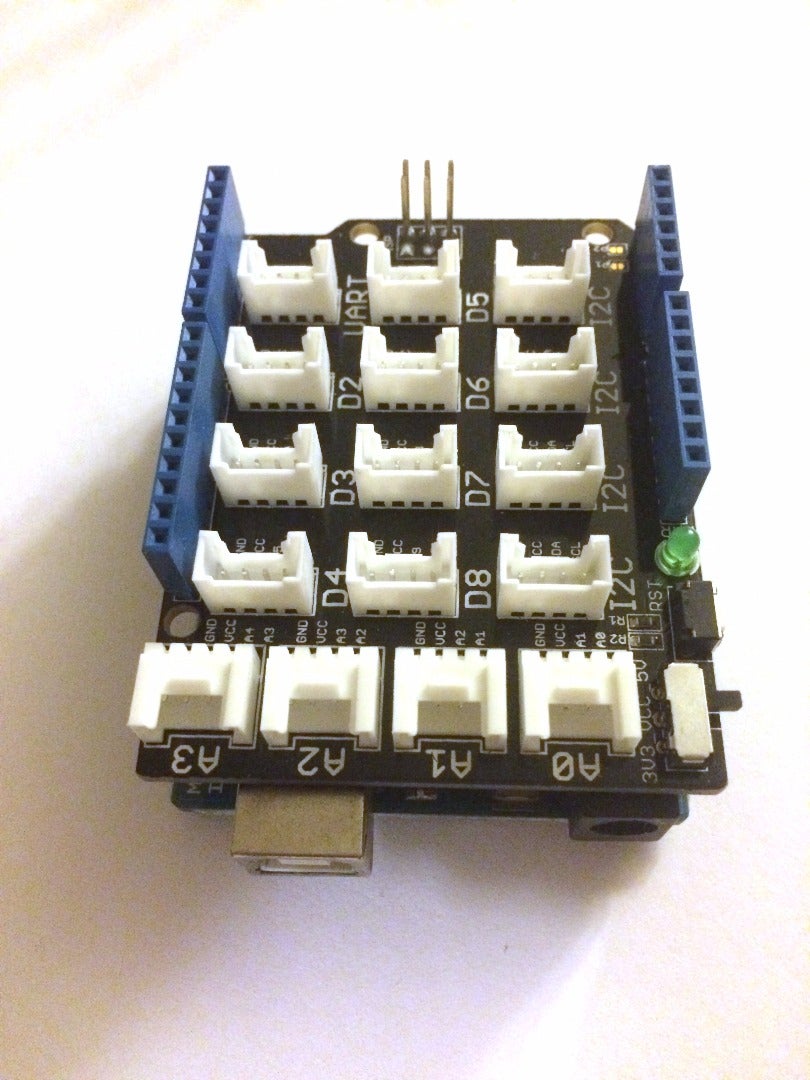
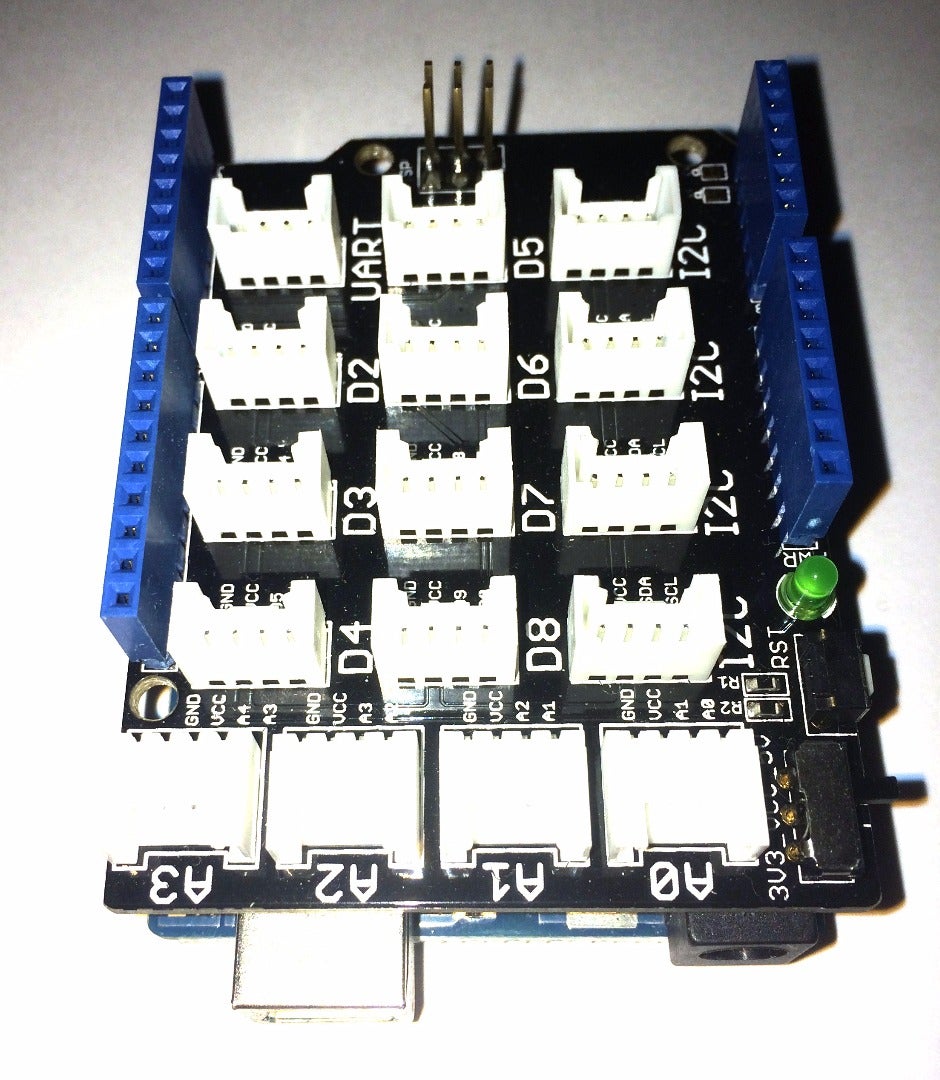
1x Grove Base Shield
1x Grove Temperature Sensor
1x Grove Cable
If using an analog temperature sensor (i.e, TMP36)
1x Arduino Uno Microcontroller
1x USB-Serial Cable for Arduino
1x TMP36 Analog Temperature Sensor
1x Prototyping breadboard
3x Jumpers for use between the Arduino and the breadboard
Step 2: Software Needed


Software Needed:
I am using Windows Operating System. You can us MacOS.
You also need an internet connection.
Software:
Arduino 1.6.7
You can download the Arduino IDE here: https://www.arduino.cc/en/Main/Software
1x Nodejs
You can install nodejs here: https://nodejs.org/en/
I downloaded the 'Mature and Dependable v4.2.4 LTS' version
1x Plotly Account (FREE!):
You can sign up for a Plotly Account Here: https://plot.ly/
Step 3: Setting Up Your Temperature Logging System

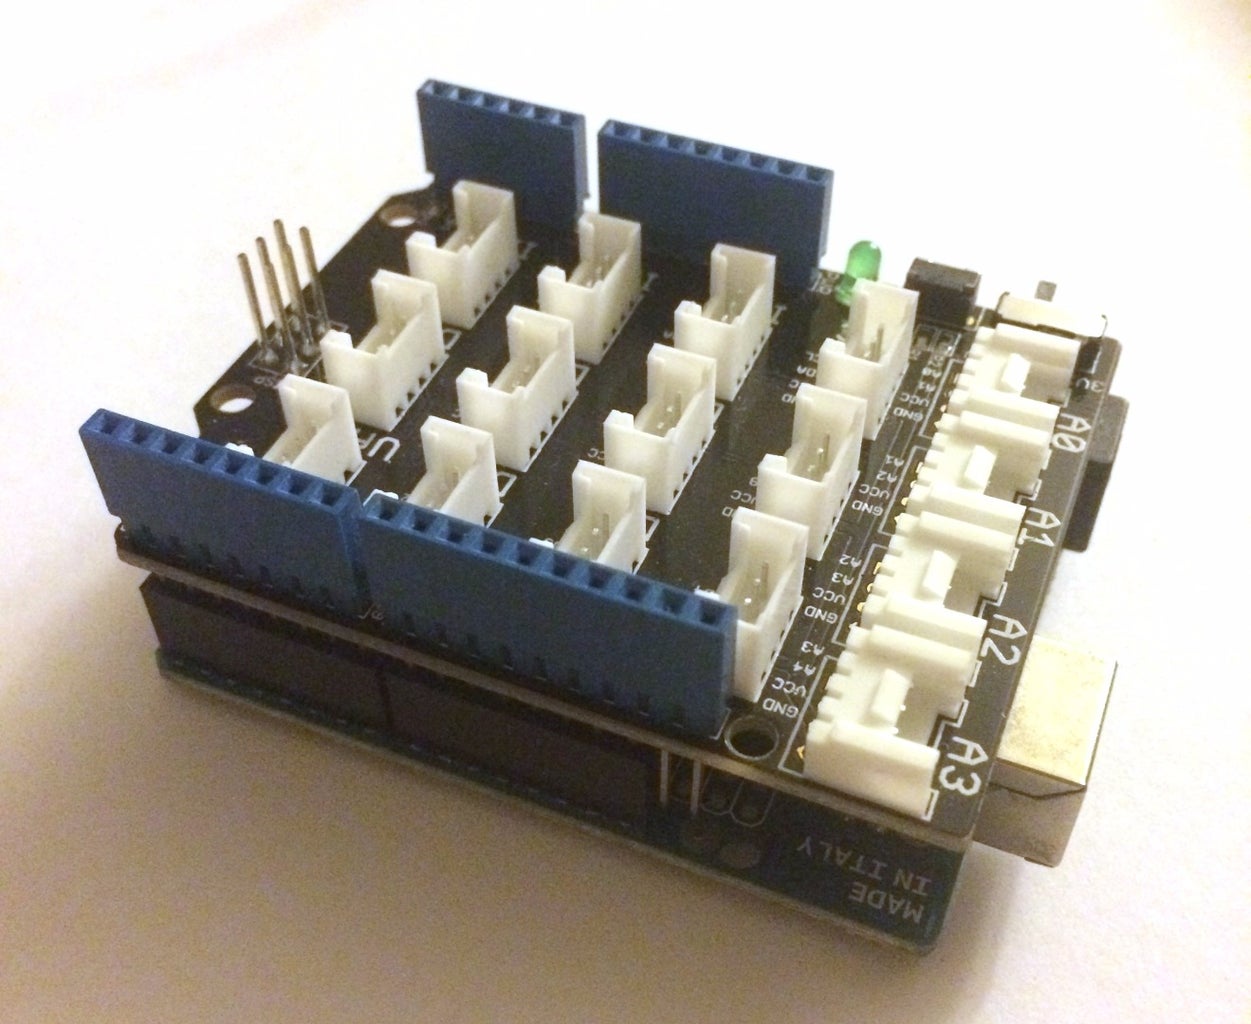
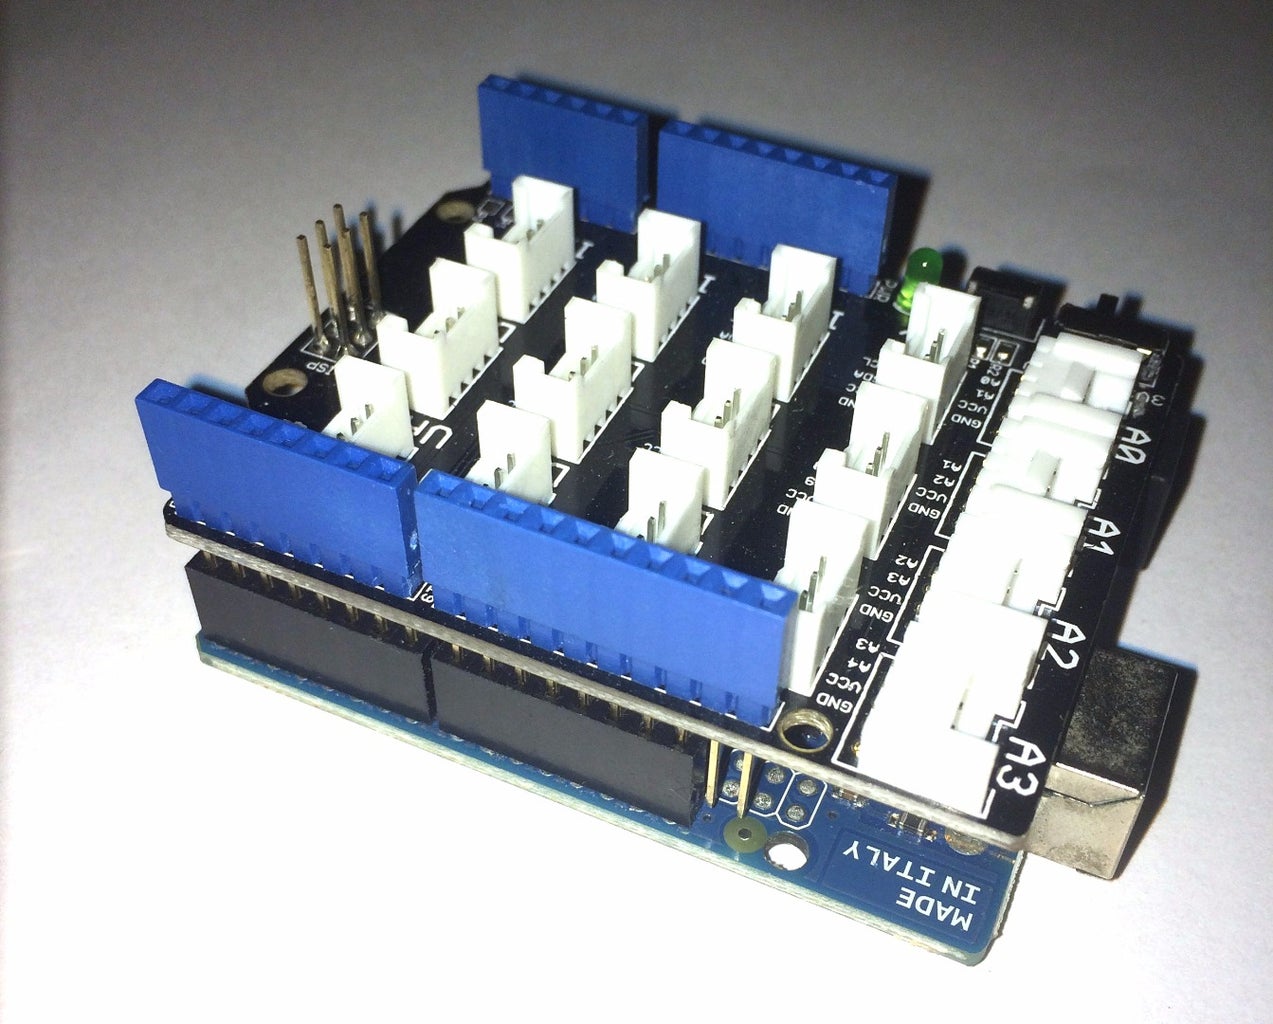
For Grove Shield and Grove Temperature Sensor Users:
1. Take your Grove Shield and place it on top of the stacking pins on the Arduino. You'll notice that there are two pins on each side that are unconnected to the Arduino. This is okay!
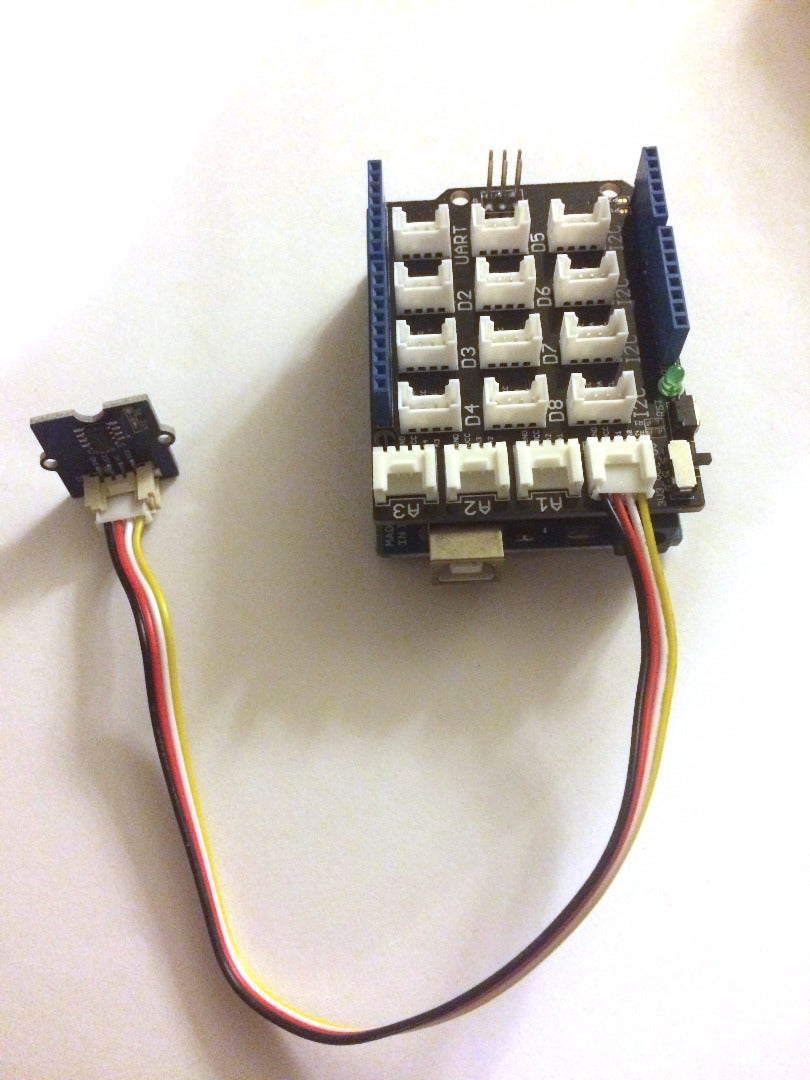
2. Take your Grove cable and connect one end into the A0 port.
3. Take the other end and connect it into the Temperature Sensor!
4. You're all set! Now just go to the next step to learn how to load the script onto the Arduino and we can see it taking the temperature readings!
For TMP36 and Breadboard Users:
The wonderful engineers at Adafruit have outlined an easy way to log temperatures using the TMP36 sensor and the Arduino. Follow the instructions to connect the TMP36 sensor to the Arduino. Stop when it starts talking about the code, because we'll be doing that in the next step.)
Step 4: Setting Up the Arduino
After installing the Arduino IDE, you can go ahead and load 'Arduino' from your Start Menu.
If this is your first time using an Arduino, please follow the instructions found at the following website (But skip Step 6 from these instructions, because we'll be loading our own file!): https://www.arduino.cc/en/Guide/Windows
Please take note of your COM port for your Arduino. We will need it at a later step.
For the Grove Shield and Grove Temperature Sensor:
Save the Temp_Example.ino file that is attached to this step. Save this file in a folder in any location where you like to save your Arduino files. The code for this sketch was taken from the Seeedstudio example: http://www.seeedstudio.com/wiki/Grove_-_Temperature_Sensor
I saved my file at: C:\Users\Documents\Arduino\Temp_Example
For those using an analog temperature sensor:
Save the TMP36_Example.ino file that is attached to this step. Save this file in a folder in any location where you like to save your Arduino files. The code is published by Adafruit, found here: https://learn.adafruit.com/tmp36-temperature-sensor/using-a-temp-sensor
In the next step, we are going to load this code into our Arduino and see the output in the Serial Monitor!

Step 5: Let's Start Reading Temperatures!


1. Navigate to where you saved the file from the last step, and load it into your Arduino!
(Once again, make sure that you have the correct Board and COM Port selected!)
2. Click Upload, and wait until the IDE tells you that the script is "Done Uploading."
3. Press Ctrl+Shift+M to open up the Arduino Serial Monitor. (Alternatively, you can click on the Magnifying Glass in the top right corner of the IDE ).
4. You should now be seeing the Temperature updating in the Serial Monitor! It will update every 1 second (1000ms).
Nice work! Now, let's go and set up our Nodejs server!
Step 6: Setting Up Nodejs
You should have installed Nodejs. If you have not yet installed Nodejs, please navigate to the Nodejs Installer webpage and install the Mature and Dependable version (v4.2.4 LTS).
Now that you have Nodejs installed, let's get started setting up the server.
1. Go to your Windows of MacOS Command Prompt. The command prompt can be found by clicking on the Start Menu and then typing in 'cmd'.
2. Once the black command prompt windows opens, type in: npm install serialport
3. Now click on the index.js file that I have attached to this step. Download this file and save it to the folder where you have Nodejs installed.
4. Open up this file in Notepad or any other text or code editor you have on your computer.
5. Go to Line 2 of this code and enter the Serial Port for your Arduino. If it is COM3, enter:
var portName = 'COM3';
6. Save this file.
7. Now go back to your Command Prompt terminal. Navigate to the folder where you have saved your index.js file. You can navigate to a directory by typing the following into your command prompt:
cd C:/Users:/Documents/Node/
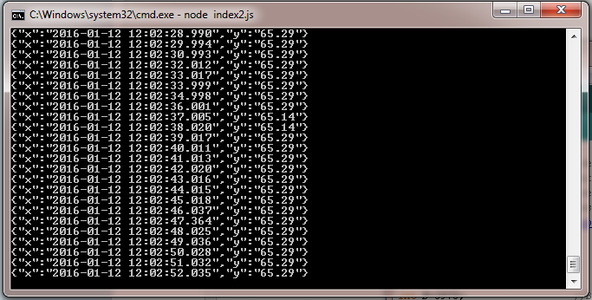
8. Now, type: node index.js
9. You should now see the temperatures updating every minute inside of your terminal!
Step 7: Upload Your Data to Plotly!

Now that you have your Nodejs server running, successfully, we are going to now send that data to Plotly!
We are going to be utilizing Plotly's Streaming API which allows us send the data from the Nodejs server to be charted on Plotly!
1. If you have not already, please create an account on Plotly.
2. Open up a new Command Prompt terminal window. Type in:
npm install plotly
3. Now click and download the file above called index2.js, and save that to the same folder where you have saved index.js.
4. Open up index2.js in a text editor and enter your Plotly_Username, Plotly_API on line 2, and your Streaming token on Line 3. On Line 5, be sure to add in the correct COM port for your Arduino.
For example, your first five lines would look like the following.
var serialport = require('serialport'),
plotly = require('plotly')('brennn10','x1x2x3x4x5'),
token = 'a1b2c3d4e5';
var portname = 'COM3';
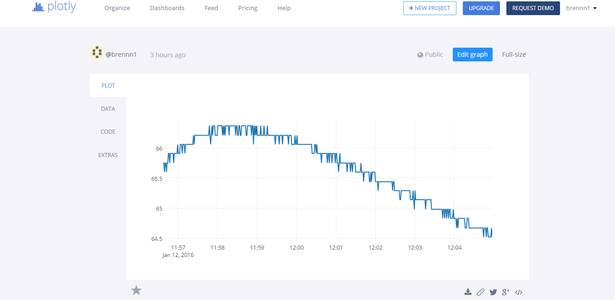
5. Save this file, and then, just as we did in the previous step. In the command prompt, navigate to the directory where you have index2.js saved. Like in the previous step, use the cd command to navigate to the directory where it is saved. Type in node index2.js and then you will start to see the data updating every second!
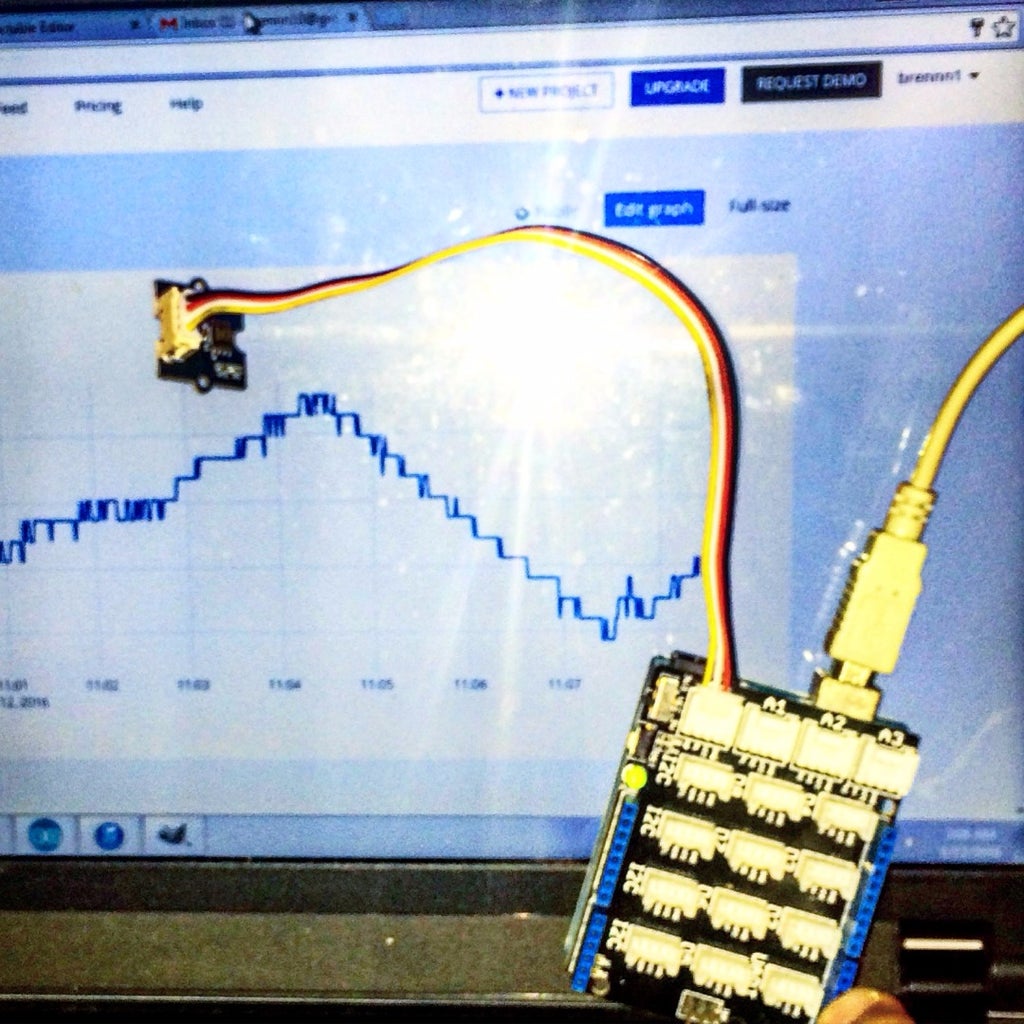
6. Now if you go to the Plotly website, navigate to your Profile, and you will see a new plot called sensor-test and your data being transmitted to the chart in real-time!
Step 8: The Possibilities Are Endless!
Now that you know the basics of sending your data to Plot.ly, you can use any other sensors and send the data to the web through the Node.js server and the Plot.ly API!
Good Luck!

Participated in the
Arduino All The Things! Contest


