Tips and Tricks for Debugging an Electron Application is an excerpt from Electron in Action, a step-by-step guide to building desktop applications that run on Windows, macOS, and Linux.
If you’d like to follow along with the techniques demonstrated in this article, you can use the electron-quick-start demo to create a minimal Electron application:
git clone https://github.com/electron/electron-quick-start
cd electron-quick-start
npm install
npm start
If you’d like a refresher on Electron, then check out our tutorial: Create Cross-Platform Desktop Node Apps with Electron.
Imagine you have a new, shiny Electron app. Everything is going smoothly for you, but it probably won’t be long before you need to debug some tricky situation. Being that Electron applications are based on Chrome, it’s no surprise that we’ve access to the Chrome Developer Tools when building Electron applications.
Debugging Renderer Processes
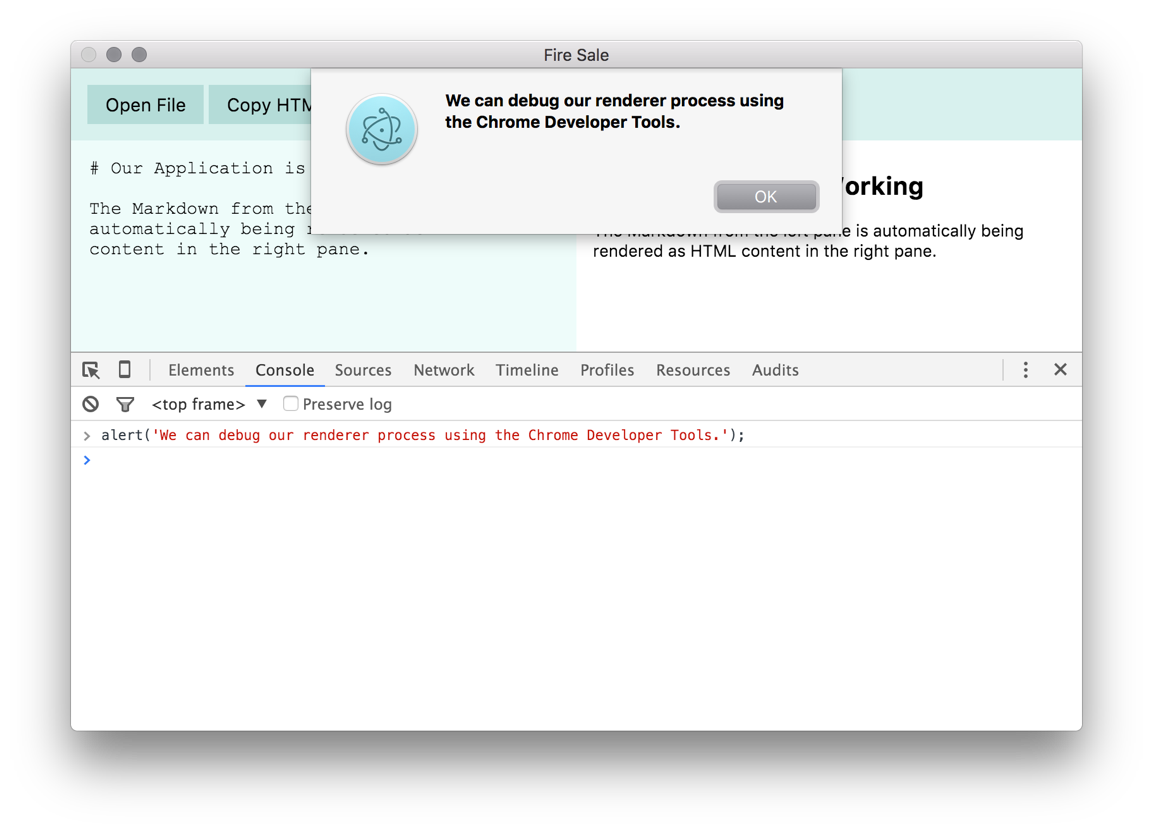
Figure 1: The Chrome Developer Tools are available to us in the renderer process like they’d be in a browser-based application.
Debugging the renderer process is relatively straight-forward. Electron’s default application menu provides a command for opening the Chrome Developer Tools in our application. You can create your own custom menu and eliminate this feature in the event that you’d prefer not to expose it your users.
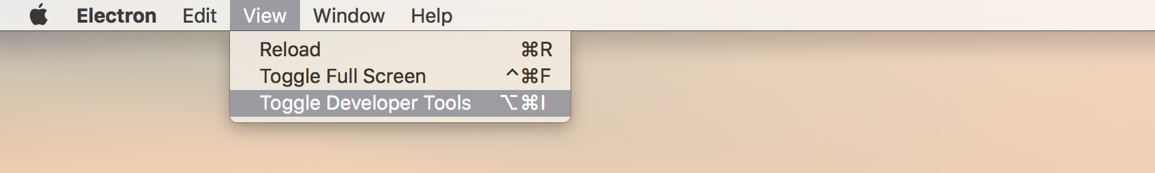
Figure 2: Figure 2 The tools can be toggled on and off in the default menu provided by Electron.
Developer Tools can be accessed in two other ways. At any point, you can press Cmd + Opt + I on macOS or Ctrl + Shift + I on Windows or Linux. In addition, you can also trigger the Developer Tools programmatically.
The webContents property on BrowserWindow instances has a method called openDevTools(). This method, as you might as expect, opens the Developer Tools in the BrowserWindow it’s called on.
app.on('ready', () => {
  mainWindow = new BrowserWindow();

  mainWindow.loadURL(`file://${__dirname}/index.html`);

  mainWindow.webContents.openDevTools();

  mainWindow.on('closed', () => {
    mainWindow = null;
  });
});
We can programmatically trigger the opening of the Developer Tools on the main window once it loads.
Debugging the Main Process
Debugging the main process isn’t easy. Node Inspector, a common tool for debugging Node.js applications, isn’t fully supported by Electron. You can start your Electron application in debug mode using the --debug flag, which will—by default—enable remote debugging on port 5858.
Limited support for using Node Inspector with Electron is available in the official documentation. As this is still somewhat in flux, you should review the most recent version of the documentation if you aren’t using Visual Studio Code. Be warned: Your mileage may vary!
Debugging the Main Process with Visual Studio Code
Visual Studio Code is a free, open-source IDE available for Windows, Linux, and macOS and has been—coincidentally—built on top of Electron by Microsoft. Visual Studio Code comes with a rich set of tools for debugging Node applications, which makes it easier to debug Electron applications. A quick way to set up a build task is to ask Visual Studio Code to build the application without a build task. Press Ctrl + Shift + B on Windows or Command + Shift + B on macOS and you’ll be prompted to create a build task as show in Figure 3.
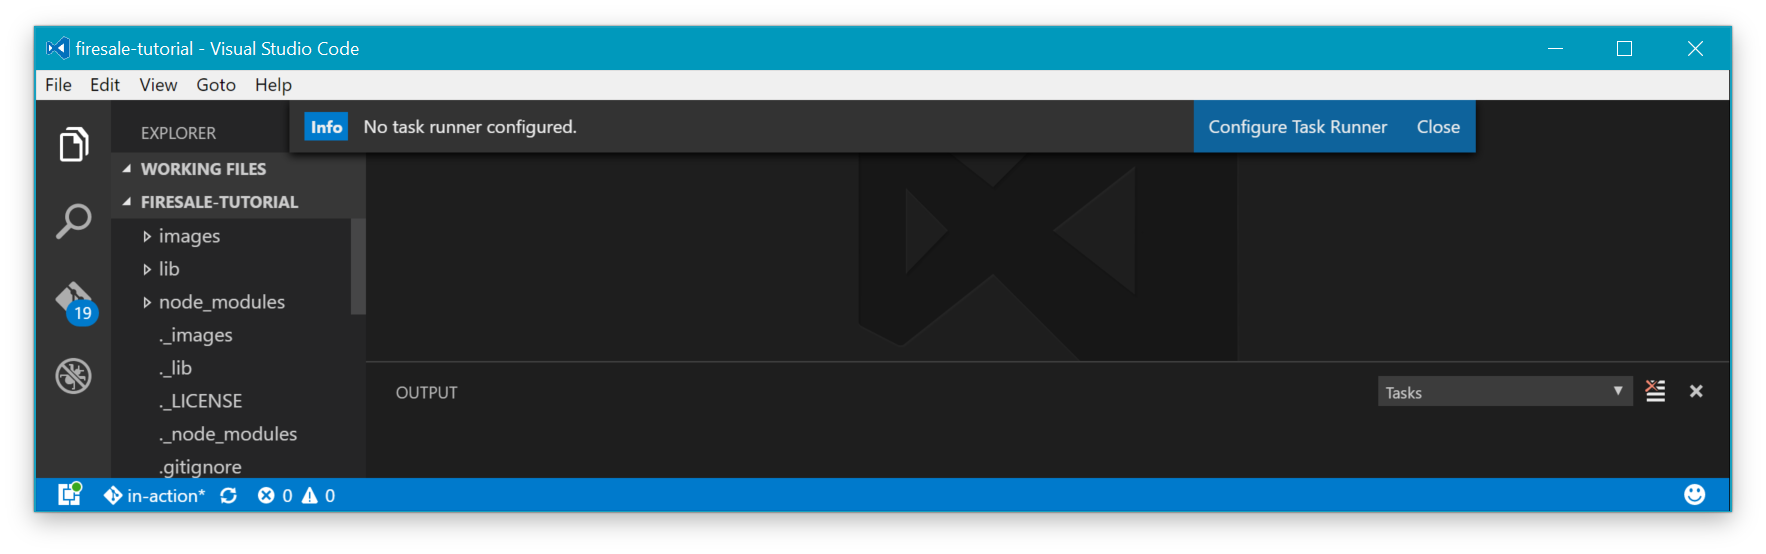
Figure 3 Triggering the build task without one in place will prompt Visual Studio Code to create one on your behalf.
Alternatively you can press Ctrl + Shift + P to open the Command Palette and type “Task”. Then select Select Tasks: Configure Task Runner, which will create a
tasks.jsonfile under a folder named.vscodeand open it.
Setting up the build and debugging tasks are similar on each platform, with one important distinction in how electron-prebuilt names the prebuilt binary for each operating system. On Windows, the binary is named electron.exe, on macOS, the binary is named Electron.app and on Linux it’s just electron.
Setting Up a Build Task in Visual Studio Code (tasks.json)
{
  "version": "0.1.0",
  "command": "node_modules/electron-prebuilt/dist/<name-of-binary>",
  "args": ["lib/main.js"]
}
Be sure to replace
<name-of-binary>with the appropriate name for your system.
Now, when you press Ctrl + Shift + B on Windows/Linux or Cmd + Shift + B on macOS, your Electron application will start up. Not only is this important to set up debugging within Visual Studio Code, it’s also a convenient way to start up the application in general. The next step is to set up Visual Studio Code to be able to launch the application and connect to its built-in debugger.
Connecting to the Debugger
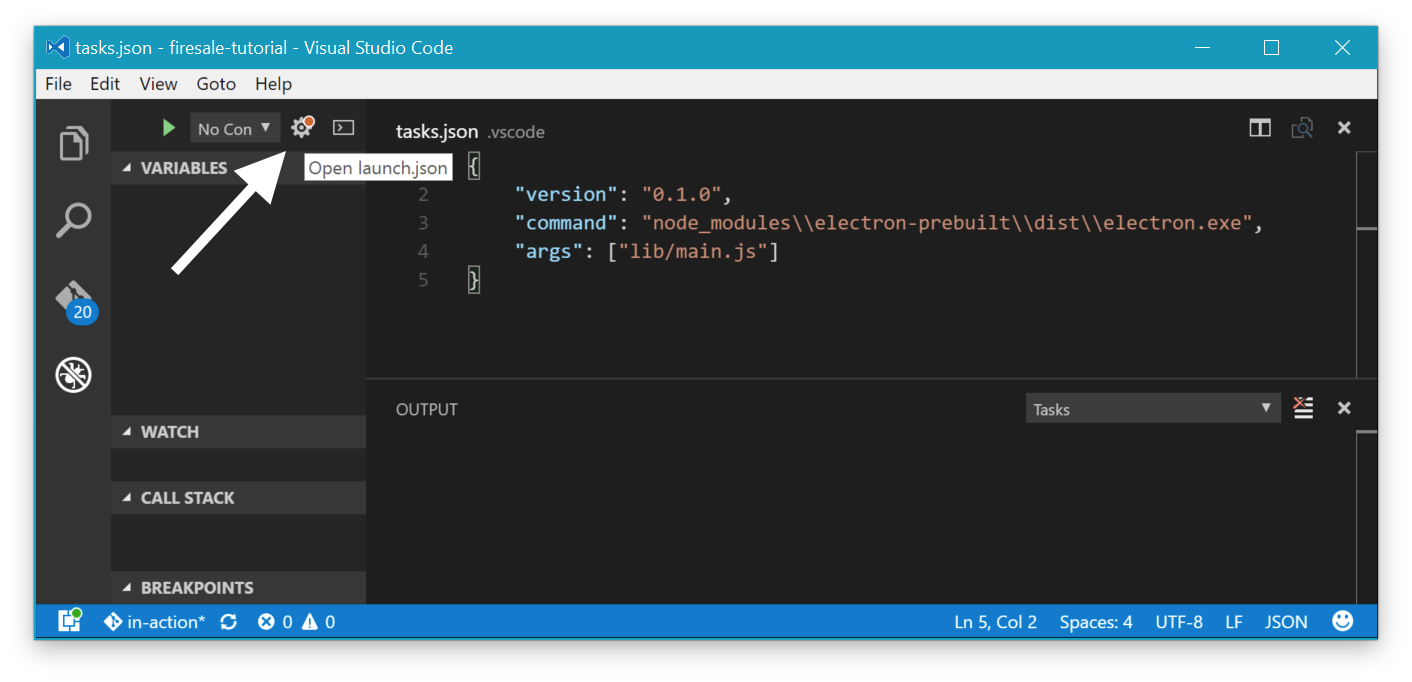
Figure 4: Inside the Debugger pane, click on the gear and Visual Studio Code will create a configuration file for launching the debugger on your behalf.
To create a launch task, go the Debugger tab in the left panel and click on the small gear (figure 4). Visual Studio Code will ask you what kind of configuration file you’d like to create. Select Node.js and replace the contents of the file with the example configuration below.
{
  "version": "0.1.0",
  "configurations": [{
    "name": "Launch main.js",
    "type": "node",
    "program": "${workspaceRoot}/lib/main.js",
    "stopOnEntry": false,
    "args": [],
    "cwd": "${workspaceRoot}",
    "runtimeExecutable": "${workspaceRoot}/node_modules/electron-prebuilt/dist/<name-of-binary>",
    "runtimeArgs": [],
    "env": { },
    "sourceMaps": false,
    "outDir": null
  }]
}
Be sure to replace
<name-of-binary>with the appropriate name for your system.
You can read more about launch configurations here.
With these two configuration files in place, you can click on the left margin of any line in your main process to set a breakpoint and then press F5 to run the application. Execution will pause at the breakpoint, allowing you to inspect the call stack, see which variables are in scope, and interact with a live console. Breakpoints aren’t the only way to debug your code. You can also watch for specific expressions or drop into the debugger whenever an uncaught exception is thrown.
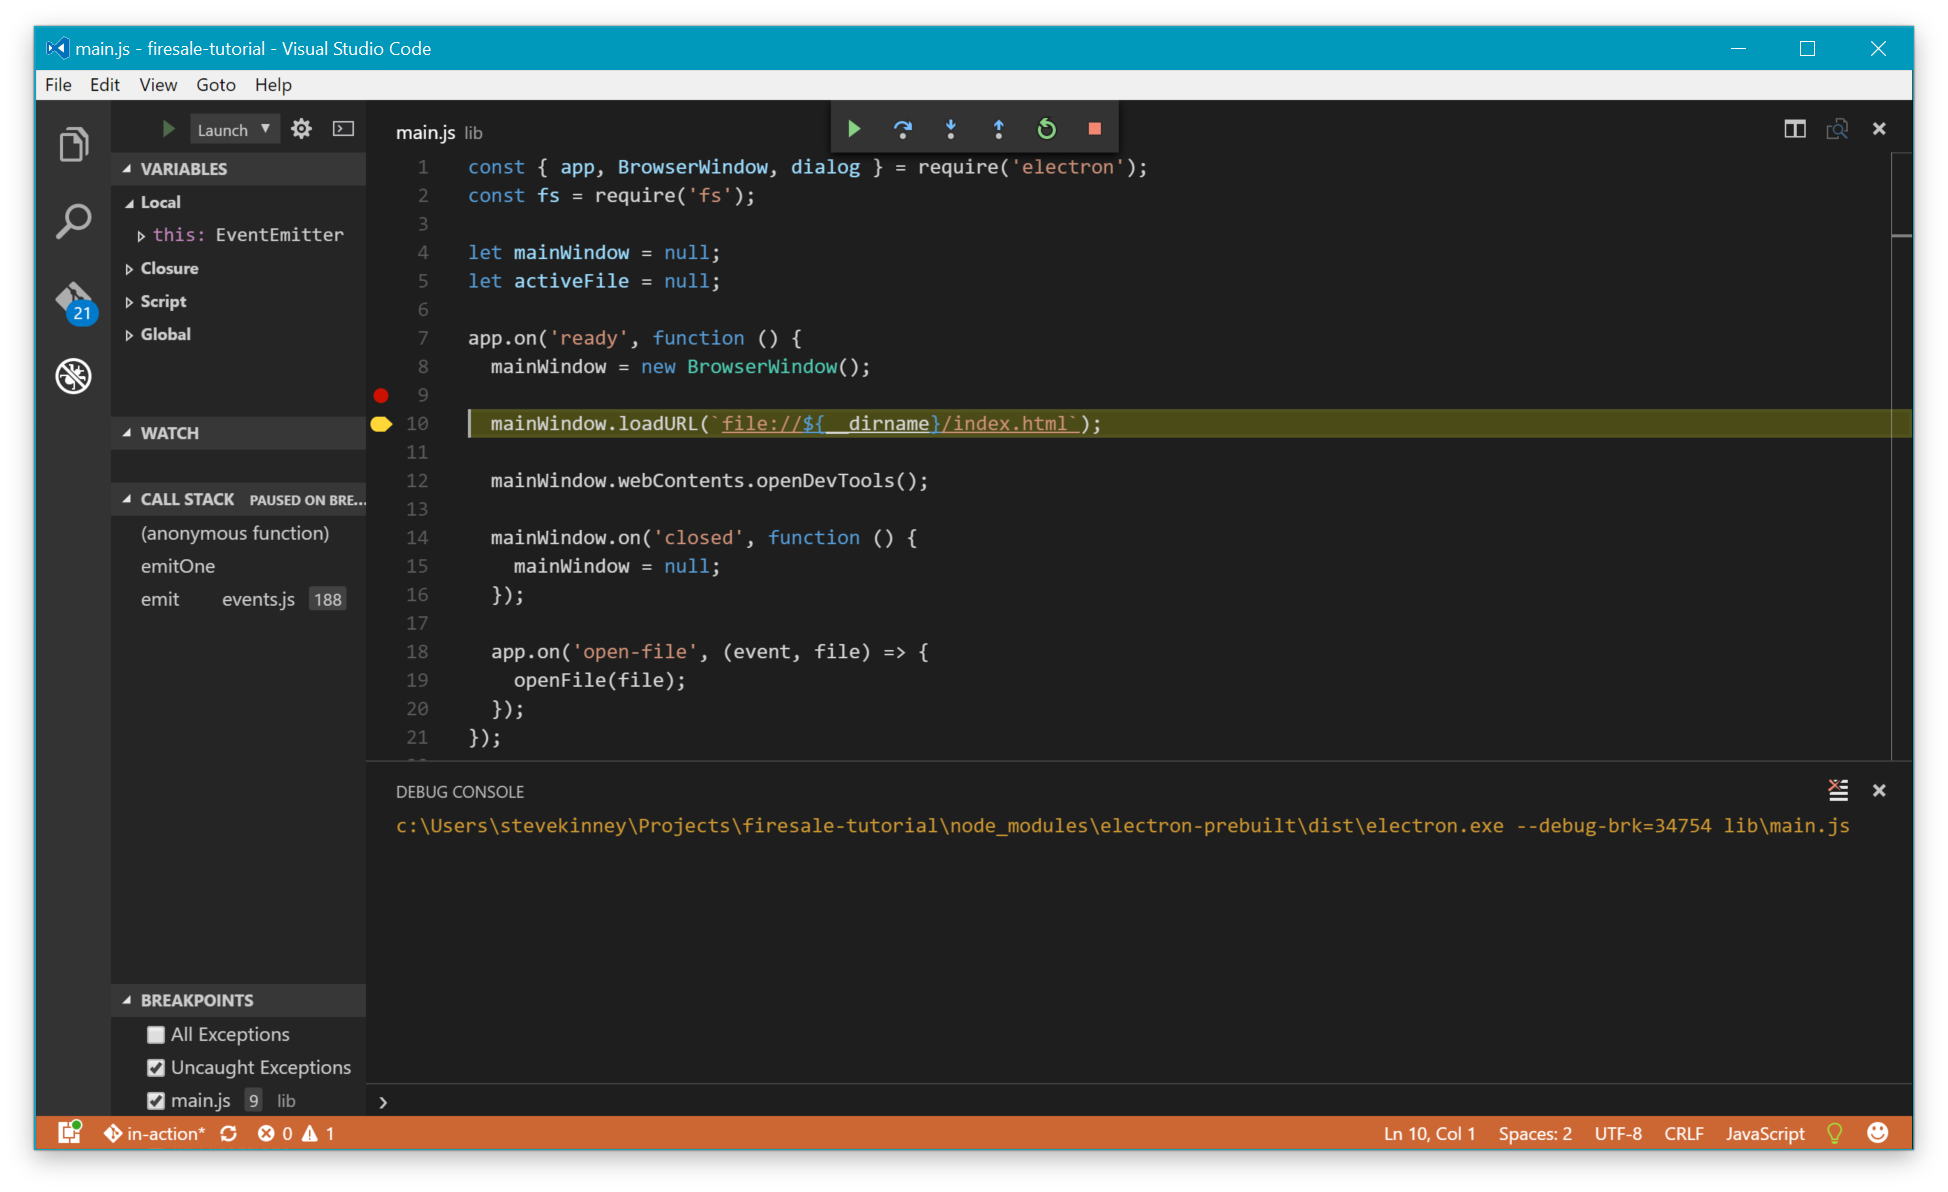
Figure 5: The debugger built in to Visual Studio code allows you to pause the execution of your application and drop in to investigate bugs.
Conclusion
Now that you know a bit more about debugging Electron apps, go download the free first chapter of Electron in Action and see this Slideshare presentation for more details on what’s inside the book.
Frequently Asked Questions (FAQs) on Debugging Electron Application
How Can I Debug an Electron Application Using Chrome DevTools?
Chrome DevTools is a set of web developer tools built directly into the Google Chrome browser. It can be used to debug JavaScript, apply styles to HTML elements, and optimize website speed. To debug an Electron application using Chrome DevTools, you need to open the DevTools in your Electron app by adding the following line of code in your main.js file: mainWindow.webContents.openDevTools(). This will open the DevTools in your Electron app, allowing you to debug your application just like you would in a browser.
What is the Role of the Main Process in Electron?
In Electron, the main process creates web pages by creating BrowserWindow instances. Each BrowserWindow instance runs the web page in its renderer process. When a BrowserWindow instance is destroyed, the corresponding renderer process is also terminated. The main process manages all web pages and their corresponding renderer processes. Each renderer process is isolated and only cares about the web page running in it.
How Can I Use Devtron for Debugging Electron Applications?
Devtron is an open-source tool from the team behind Electron. It’s designed to help you understand, debug, and optimize your Electron applications. It can be installed as a devDependency in your app with the following command: npm install --save-dev devtron. Once installed, you can require and install Devtron in your application’s main process with these lines of code: const devtron = require('devtron'); devtron.install();.
How Can I Debug the Main Process in Electron?
Debugging the main process in Electron can be done using the Chrome DevTools and an npm package called electron-debug. First, install electron-debug in your project using the command npm install electron-debug --save-dev. Then, include it in your main.js file with require('electron-debug')();. Now, you can open Chrome DevTools for the main process by pressing Ctrl+Shift+I or Command+Option+I.
How Can I Use Spectron for End-to-End Testing in Electron?
Spectron is a framework for automating Electron applications. It’s built on ChromeDriver and WebDriverIO for emulating user interaction. To use Spectron, install it as a devDependency in your project with npm install --save-dev spectron. Then, you can require it in your test files and use it to emulate user interactions, check application state, and validate application output.
How Can I Debug Renderer Process in Electron?
Debugging the renderer process in Electron is similar to debugging any web page. You can use Chrome DevTools, which can be opened with a right-click on the page and selecting ‘Inspect’ or ‘Inspect Element’. If you want to open DevTools programmatically, you can use win.webContents.openDevTools() in your main.js file, where ‘win’ is the instance of your window.
How Can I Use Electron-Debug for Debugging Electron Applications?
Electron-debug is a useful module for debugging Electron applications. It allows you to add useful debug features with a minimal amount of implementation effort. You can install it as a devDependency with npm install electron-debug --save-dev. Once installed, you can require it in your main.js file with require('electron-debug')();. This will enable the default debug features.
How Can I Use Chrome DevTools Extensions in Electron?
Electron supports Chrome DevTools extensions, which can be used to extend the functionality of Chrome DevTools. To use a DevTools extension, you need to first download it in Chrome browser, then locate its install directory and finally load it in your Electron app using BrowserWindow.addDevToolsExtension(path), where ‘path’ is the path to the extension’s directory.
How Can I Debug Electron Applications in Visual Studio Code?
Visual Studio Code (VS Code) is a popular code editor that supports debugging of Electron applications. To debug Electron applications in VS Code, you need to configure the launch.json file in your .vscode directory. The configuration should specify the main.js file as the program to start and use the ‘electron’ runtime.
How Can I Use Electron-Devtools-Installer for Installing DevTools Extensions?
Electron-devtools-installer is a package that makes it easy to install DevTools extensions into Electron. You can install it as a devDependency with npm install electron-devtools-installer --save-dev. Once installed, you can use it to install any Chrome DevTools extension by its extension ID.
 Steve Kinney
Steve is the Director of the Front-End Engineering Program at the Turing School of Software and Design. He is also the organizer of Dinosaur.js, part of the JSConf family of events, and author of the book Electron in Action.