
Over the last few years, smart home devices have gone from less than 300,000 back in 2015 up to almost 1.2 billion in 2020. And they’re expected to grow to 1.5 billion by 2021.
So it's likely you have at least some smart devices in your home, given that the average will reach 8.7 smart devices per home by 2021.
As developers, we have some advantage in this domain, since we can build our own smart home devices.
It’s not only the devices that have experienced rapid development. The development boards used for them have started to become more and more commercial and accessible.
In this article, we will see how we can use a Raspberry Pi, an LCD screen, and a few lines of code to monitor the weather outside or for a specific location.
Because this is a Do It Yourself (DIY) project, there are some prerequisites that we need for this device.
Prerequisites
- Raspberry Pi 3 (or higher)
- LCD Screen
- Connection Wires
- Potentiometer (Optional)
- Breadboard (Optional)
How to Build It
As soon as we have everything we need we can start. Let's take it step by step.
Step I - Base Configuration
The first step consists of the basic setup and a verification of all the components.
For this demo, we will use the ClimaCell Weather API as a weather data provider, as they have a large number of indicators, including air quality indicators, for us to use.
To use their API we must open an account on their platform and get an API key, which we’ll use to sign our requests.
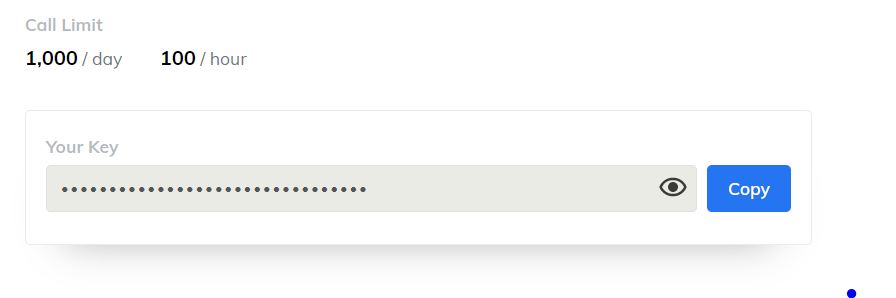
The account is free to open and it comes with a 100-hour limit of API calls, which is more than enough for our project.
As soon as we have this API key, we can move to the hardware configuration and connect the LCD screen to our Raspberry Pi. You should turn the Raspberry Pi off while you make the wire connection.
The pin layout for Raspberry Pi 3 can be seen in the next image.
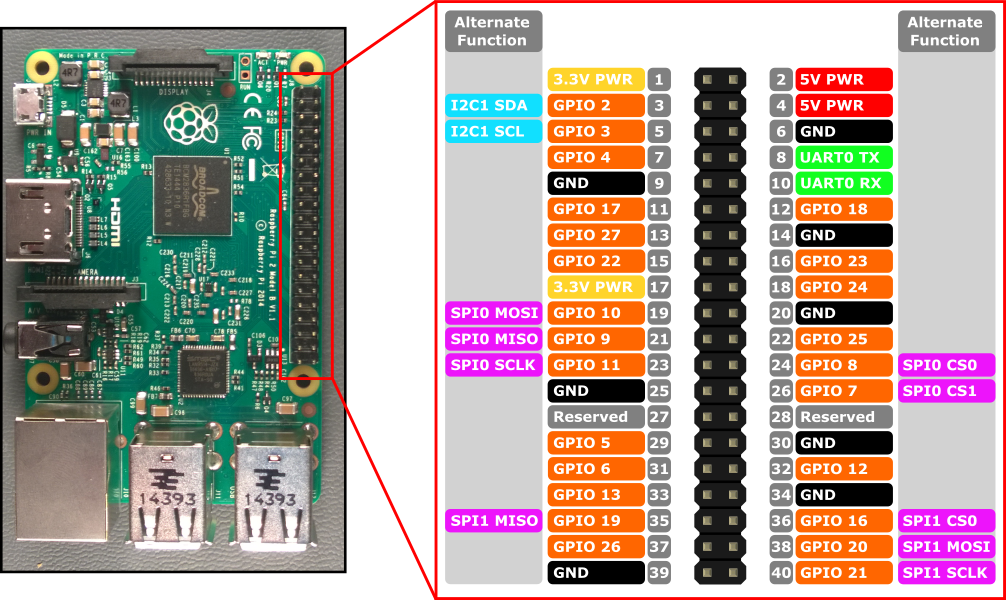
The wire connection between the LCD and the development board is the following:
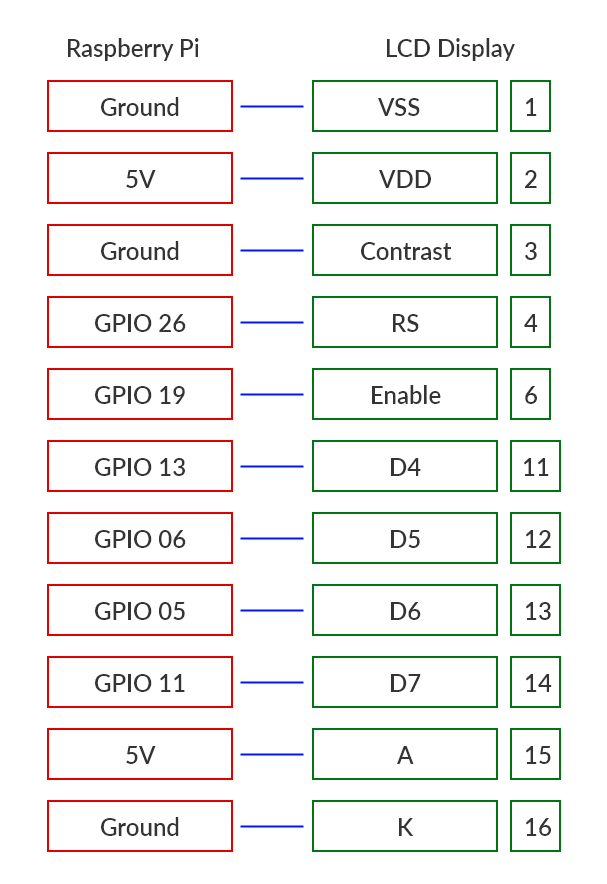
This hardware connection will make the LCD screen be on full brightness and full contrast. The brightness level is not a problem, but contrast is because we won’t be able to see the characters on the screen.
That’s why we need to introduce at least one potentiometer with which to set the contrast level.
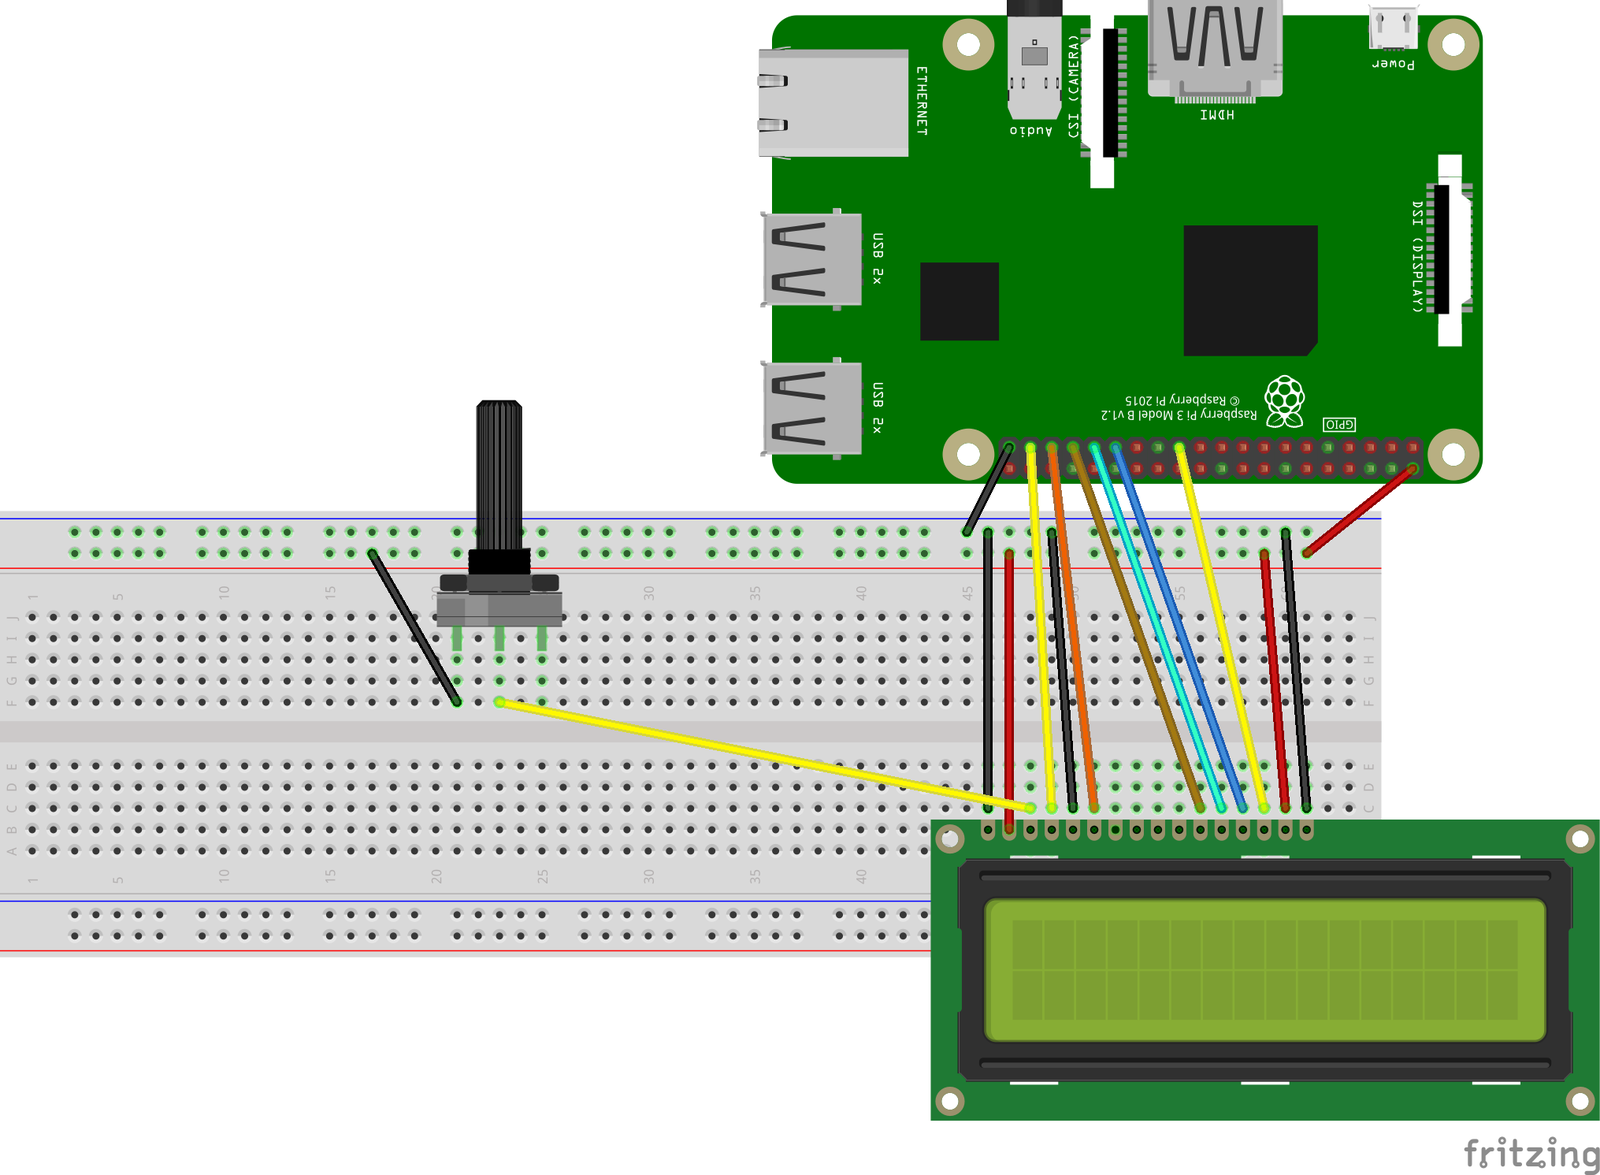
At this point, we can turn on our Raspberry Pi and we should see the LCD screen alive. With the help of variable resistance we should be able to control the contrast.
Step II - Project Configuration
As a programming language, we’ll use NodeJS to write the code. If you don’t already have NodeJS installed on your Raspberry then you can follow these simple instructions.
In a new folder, run the command npm init -y to set up a new npm package, followed by the command npm install lcd node-fetch to install these 2 necessary dependencies.
lcdwill be used to communicate with the LCD Screennode-fetchwill be used to make HTTP requests to ClimaCell API.
We said that we need an API key to communicate with the weather data provider. You place your secret API key directly in the main code, or you can create a config.json file in which you can place this key and any other code-related configuration you may have.
config.json
{ "cc_key": "<your_ClimaCell_API_key>"}Lastly, let’s create the main file of our project and include all these things we talked about.
// * Dependencies
const Lcd = require("lcd");
const fs = require("fs");
const fetch = require("node-fetch");

// * Globals
const { cc_key } = JSON.parse(fs.readFileSync("./config.json"));
Step III - The LCD
Writing on the screen is a piece of cake using the lcd module. This library acts as a layer of abstraction over how we communicate with the device. In this way we don’t need to micro-manage each command individually.
The entire code for our LCD screen is the following:
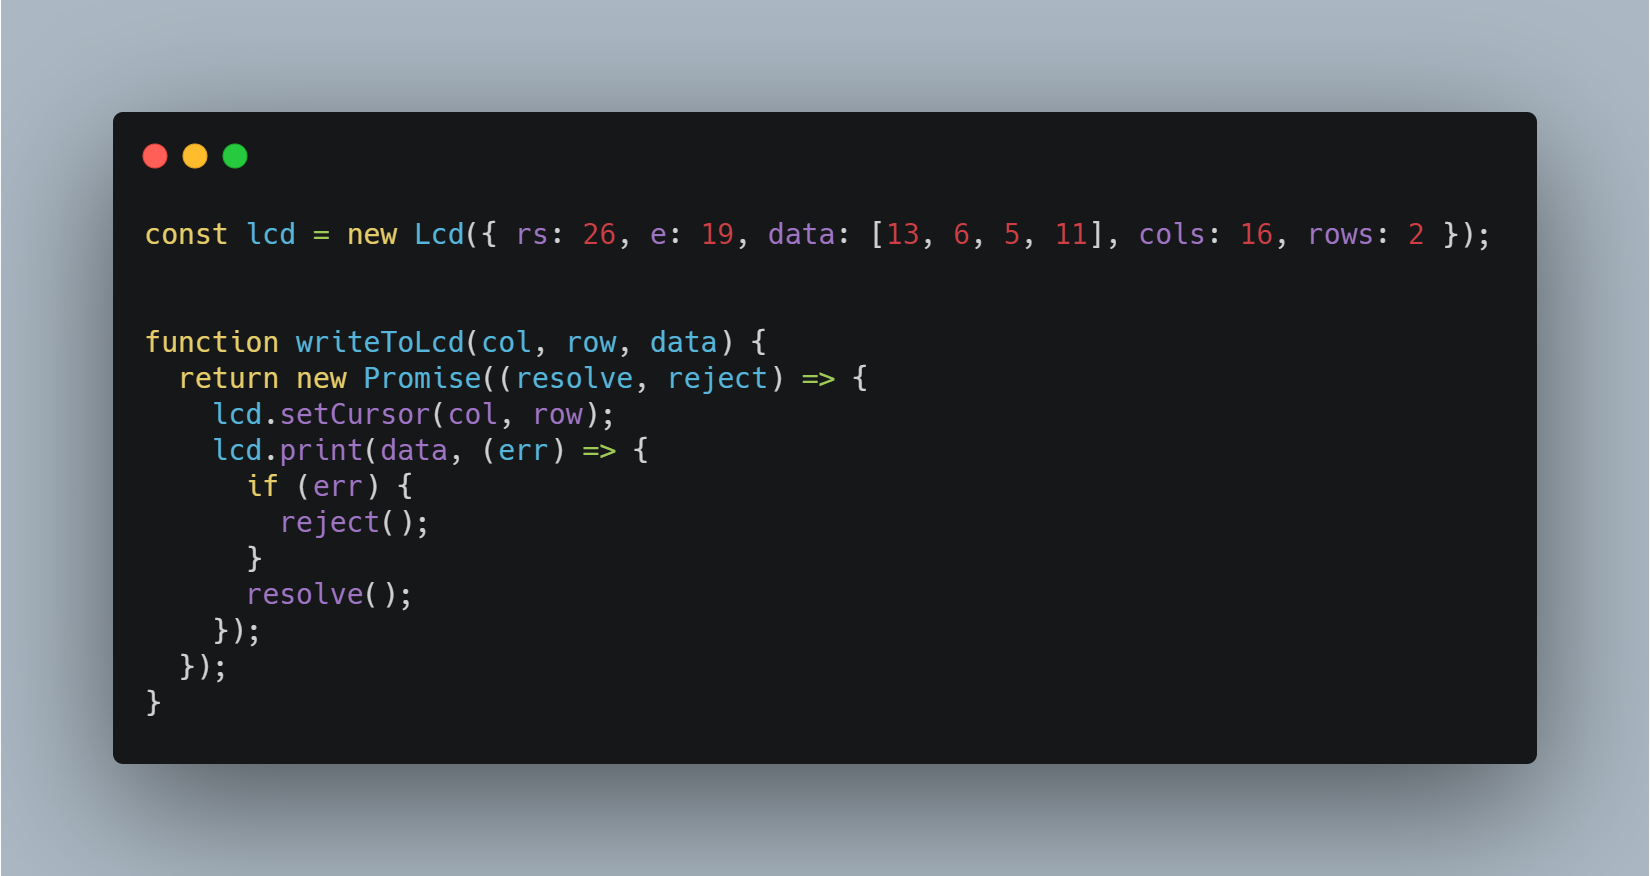
The first step was to create a new lcd object and to pass as argument the pins we’ve used.
The keys cols and rows represent the number of columns and rows of our LCD display. 16x2 is the one I used in this example. If your LCD has just 8 columns and 1 row, then replace 16 and 2 with your values.
To write something on the display we need to use these two methods successively:
- lcd.setCursor() - selecting the position from which to start writing
- lcd.print()
At the same time, we wrapped these two functions in a promise to make use of async/away keywords.
At this point, you can use this function and print something on your display. writeToLcd(0,0,'Hello World') should print the message Hello World on the first row starting from the first column.
Step IV - The Weather Data
The next step is to get the weather data and print it on the display.
ClimaCell provides a lot of weather data information, but also air quality and pollen, fire and other information. The data is vast, but keep in mind that your LCD screen only has 16 columns and 2 rows – that’s just 32 characters.
If you want to display more types of data and this limit is too small for you, then you can use a scroll effect.
For this demo we’ll keep it simple and we’ll print on the LCD screen the following data:
- current date (hour, minutes, seconds)
- temperature
- precipitation intensity
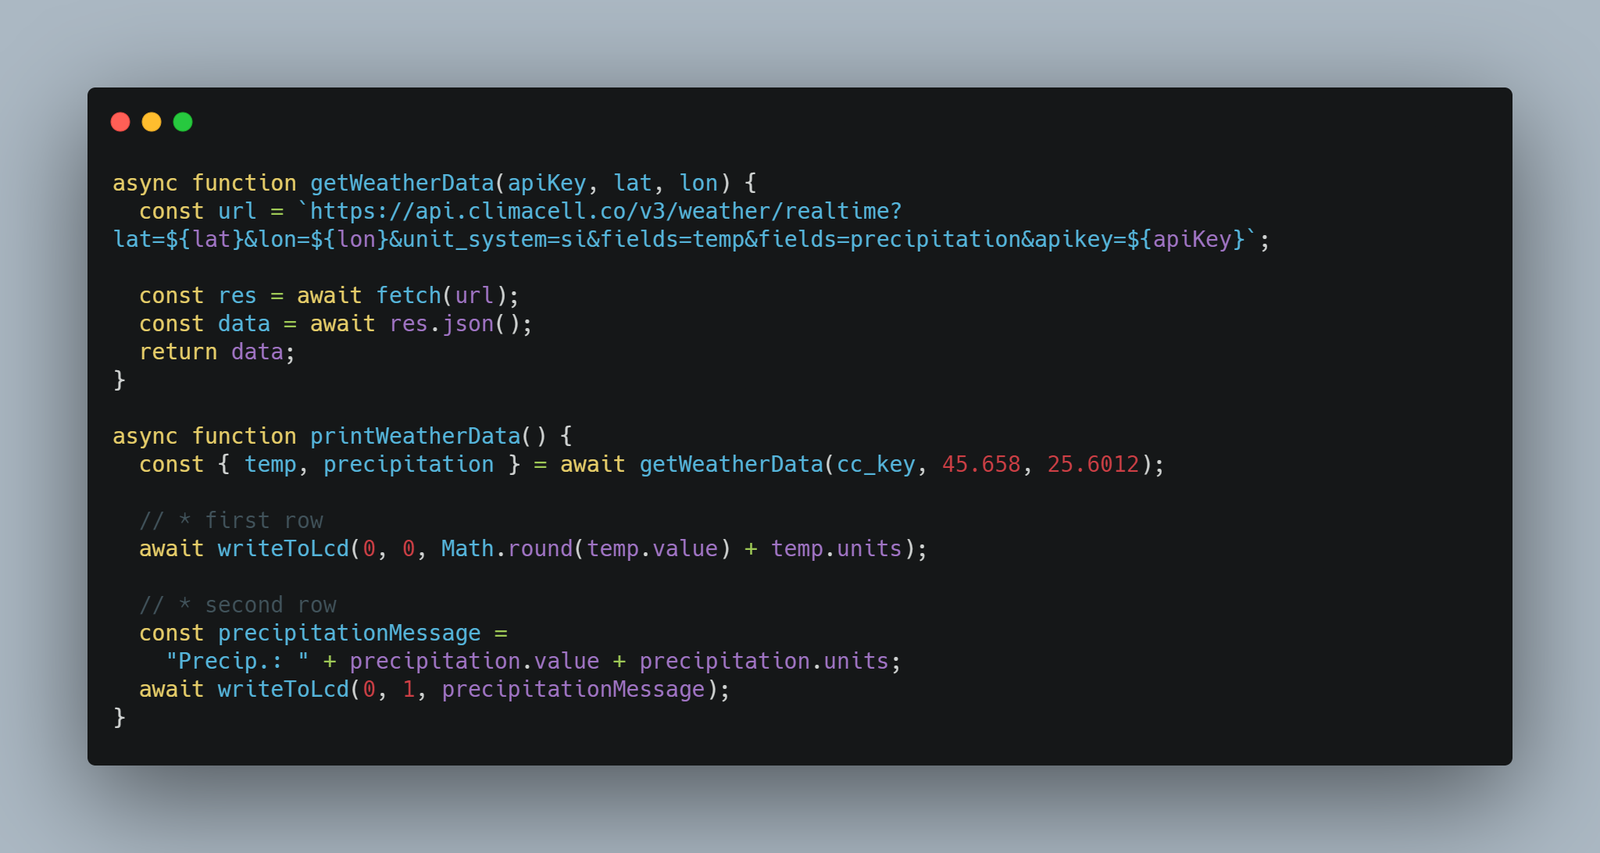
To get data from ClimaCell for a specific location, then you need to send its geographical coordinates, latitude and longitude.
To find your city’s coordinates, you can use a free tool like latlong.net and then you can save them in config.json file along with your API key, or you can write them directly in the code.
At this point the data format returned by the API call is the following:
{
  lat: 45.658,
  lon: 25.6012,
  temp: { value: 17.56, units: 'C' },
  precipitation: { value: 0.3478, units: 'mm/hr' },
  observation_time: { value: '2020-06-22T16:30:22.941Z' }
}
We can deconstruct this object and get the temp and the precipitation values and print them on the first and second row.
Step V - Wrap it Up
All we need to do now is to write the logic for our script, and update the LCD screen when new data arrives.
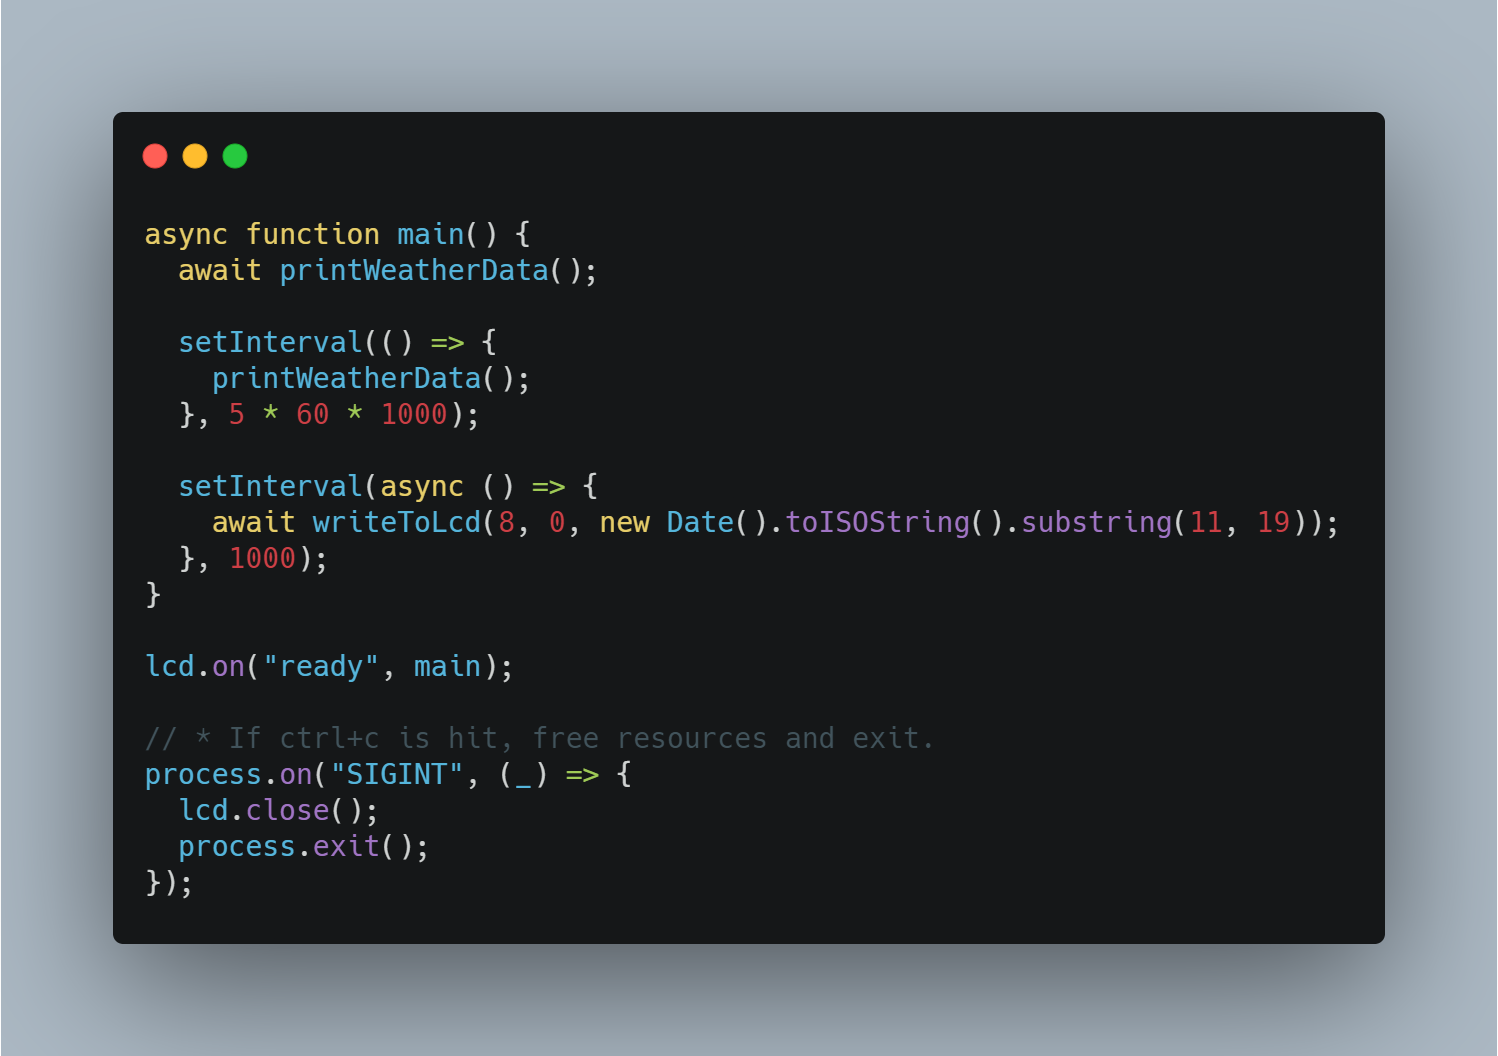
The weather data is updated every 5 minutes. But because we have a limit of 100 API Calls / Hour imposed by ClimaCell, we can go even further and update the weather data each minute.
For the current date, we have two options:
- we can use the property
observation_timeand display the date at which the data was received, or - we can make a real clock and display the current time.
I chose the second option, but feel free to do it as you please.
To print the time in the upper right corner, we must first calculate the starting column so that the text fits snugly. For this we can use the next formula total columns number minus text to display length
The date has 8 characters and because he has 16 columns, we must start from column number 8.
The LCD setting is asynchronous, so we must use the method lcd.on() provided by the related library, so we know when the LCD has been initialized and is ready to be used.
Another best practice in embedded systems is to close and free the resources that you use. That’s why we use the SIGNINT event to close the LCD screen when the program is stopped. Other events like this one include:
SIGUSR1andSIGUSR2- to catch "kill pid” like nodemon restartuncaughtException- to catch uncaught exceptions
Step VI - Run it Forever
The script is complete and at this point we can run our program. We just have one more thing we must do before we can finish.
At this point you’re probably connected to your Raspberry Pi using SSH or directly with an HDMI cable and a monitor. No matter what, when you close your terminal the program will stop.
At the same time if you power off your device and after some time or immediately power it on again, the script will not start and you’ll have to do it manually.
To solve this problem, we can use a process manager like pm2.
Here are the steps:
sudo npm install pm2 -g- install pm2sudo pm2 startup- create a startup script for pm2 managerpm2 start index.js- start an applicationpm2 save- save your process list across server restart
Now you can reboot your board and the script will start automatically when the device is ready.
Conclusion
From this point you can customize your new device however you want. If you find this weather data important for you (or any other data from ClimaCell, like air pollution, pollen, fire index or road risk), you can create a custom case to put the Raspberry Pi and the LCD display in it. Then after you added a battery you can place the device in your house.
Raspberry Pi is like a personal computer, so you can do much more on it than you would normally do on a microcontroller like Arduino. Because of this, it's easy to combine it with other devices you have in your house.